
Trying to write more
In middle school, my writing always lagged behind my math, but in high school it improved steadily because I wrote a ton of essays and I had great English teachers. I remember Ms Perry having me use a web app, Write or Die, which was hilarious and excellent practice in learning to push through writer’s block. In senior spring, I distinctly remember feeling that I was reaching a newfound level of writing fluency. My thoughts would cascade onto the page in well-formed, flowing sentences, like a jazz improvisation. My fingers could keep up with my brain.
In college, I started taking more math classes and writing less. I achieved flow state a couple times– once in Roberto Unger’s Conduct of Life course– but I was starting to struggle. I’d take a break every five minutes and flop onto my bed, exhausted with the effort of thinking of synonyms for filler words I’d used too many times in a row. My brain was still fast, but my fingers were slow. And pulling all-nighters during finals season didn’t help!
After I left the ivory tower in 2019, I basically stopped writing, aside from very short journal entries and messages. In 2021 I realized that I hadn’t written an essay in ages and that I had lost quite a bit of fluency. I could still write text messages, but I’d spend an hour on an email, which, after pressing send, I’d read back and think, “Ugh, it sounded so much better in my head!” In 2025, I attempted to write a paper for a Stanford civil engineering class. It was like pulling teeth. I kept leaving sentences unfinished. I’d get stuck for 5-10 seconds and frantically jump to the next point while trying to keep the logical structure in my head from collapsing. My brain was still fast, but my fingers were glacial.
I’ve heard it said many times that the average adult’s neuroplasticity starts declining at age 25. However I recently came across an article claiming that the brain stays in “adolescent phase” until it peaks in the early 30s. So, hey, I’ve got time! Apparently I’ve got 3 years left to squeeze every remaining ounce of potential out of my weakening flab of gray matter.
Therefore, my new year’s resolution is to write more. Long form.
Wellll… at least medium form. 🙂
I want to develop a friendly narrative voice. I want my writing to be readable, like good technical documentation, but with a bit of personality showing through. I do not want it to be “good”. (Wanting to be “good” is the enemy of joy.) I just want it to be good enough. Essentially, I want to be able to get my thoughts out without feeling stuck. I’ve accumulated a long list of topics to write about, and I need to relieve this mental and emotional constipation asap.
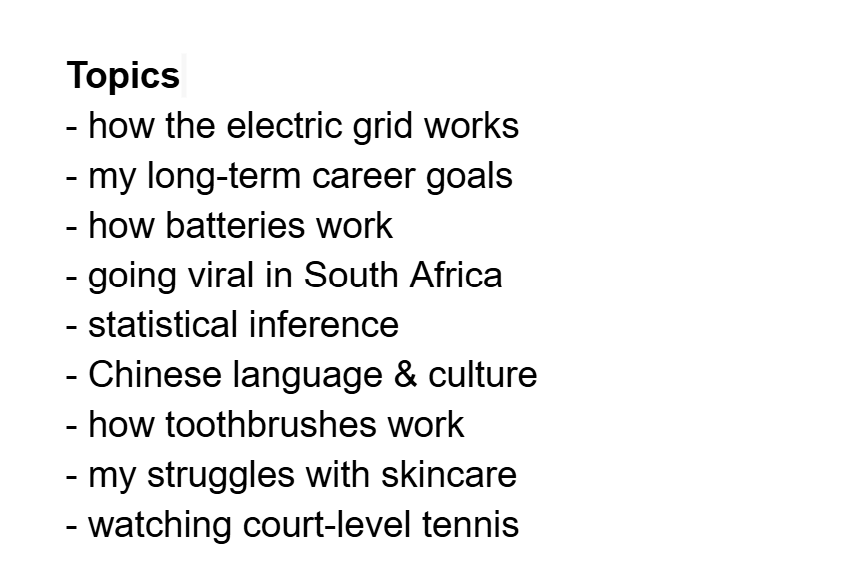 The list as of Jan 2026.
So let’s get started with item number 1: how the electric grid works. I’ll recap my aforementioned Stanford engineering essay, then I’ll connect that to my broader career journey and goals.
Exploring the grid’s wildfire resilience through Power Systems Analysis
We all know that wildfires are getting worse due to climate change. But wildfires themselves are also making climate change worse. They damage transmission lines, forcing grid operators to either shed load or rely on backup “peaker” plants, which are usually the dirtiest and most expensive sources of power.
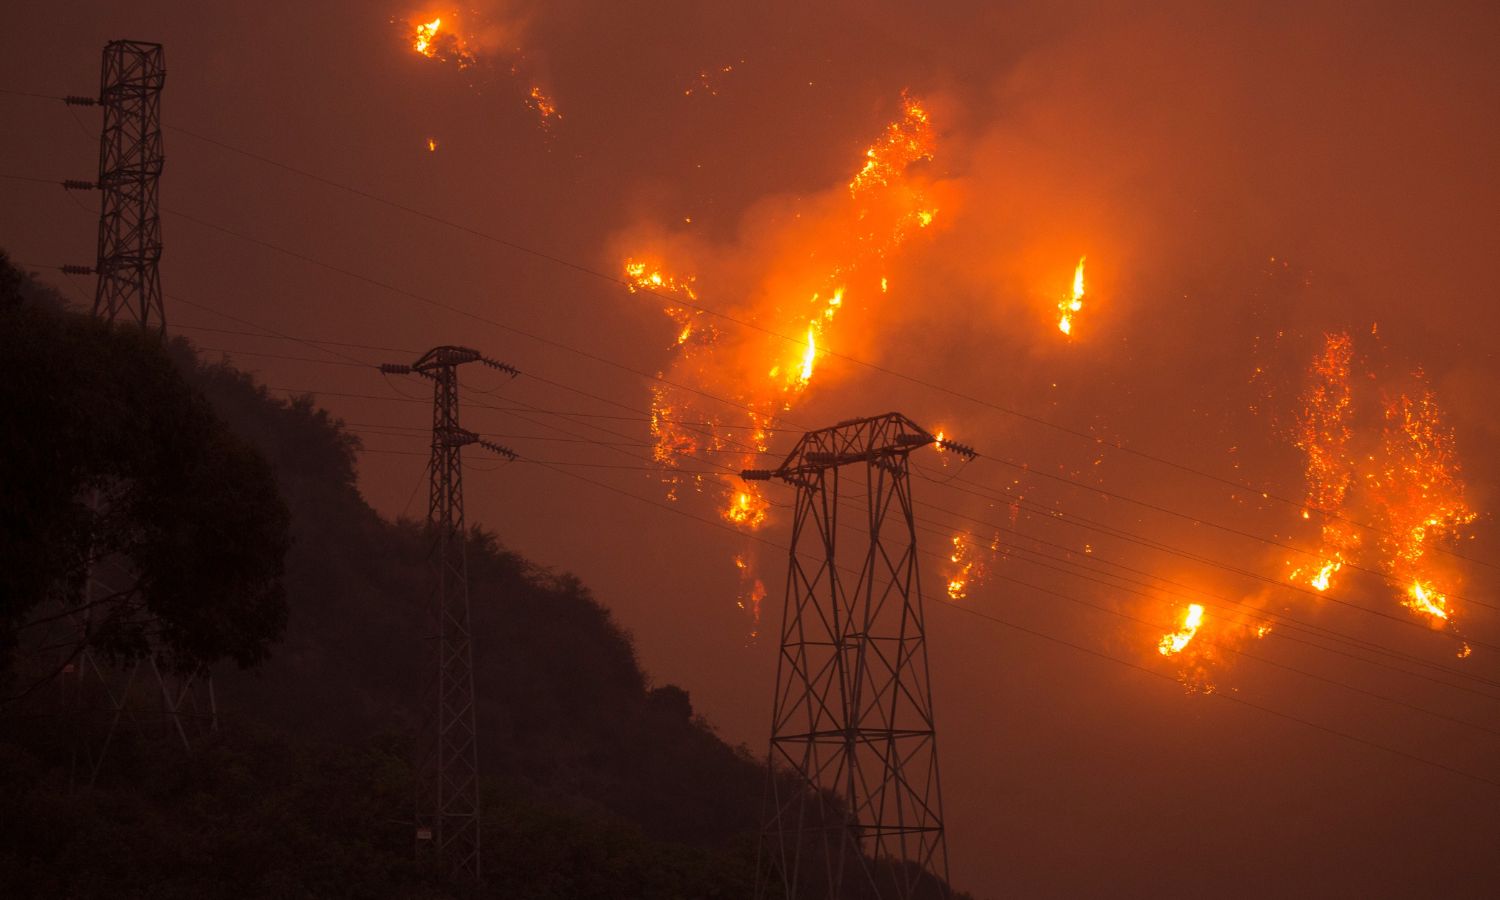
The electrical grid exists in a delicate state of balance, and two or three downed power lines can easily throw things out of whack. The necessity of maintaining this state of balance is what makes the electrical grid a different beast from, say, the water system. We can store water in aquifers and control its movement with pumps and valves. But electrical energy, for the most part, is transmitted and consumed at the exact instant it is produced. And we don’t control how much energy goes through this wire versus that wire. There are laws of physics (known as Kirchoff’s laws) that describe how the voltage and current flowing through a system must behave in equilibrium. If anything happens in one corner of the system, it affects the entire system– often in ways that are hard to predict. For example, building a new transmission line can actually make things worse by creating less efficient flow paths. (This is known as Braess’ paradox.)
Utilities need to decide where to build new transmission, distribution, and generation. To do this, they run mathematical simulations. The bread-and-butter model for doing so is known as Optimal Power Flow (OPF).
OPF starts with the power flow equations, which are derived from Kirchoff’s laws (figure 1). We apply some simplifying assumptions to make it easier to solve them1. This gives us a set of constraints. We then add a few more constraints for things like “Don’t let the voltage on this line exceed X, or else it’ll overheat and possibly spark a fire”. Then we define an objective function: the dollar cost of constructing and operating the grid. Our goal is to minimize this cost subject to the constraints. We now have a well-defined optimization problem, and there are efficient techniques to solve it 2.
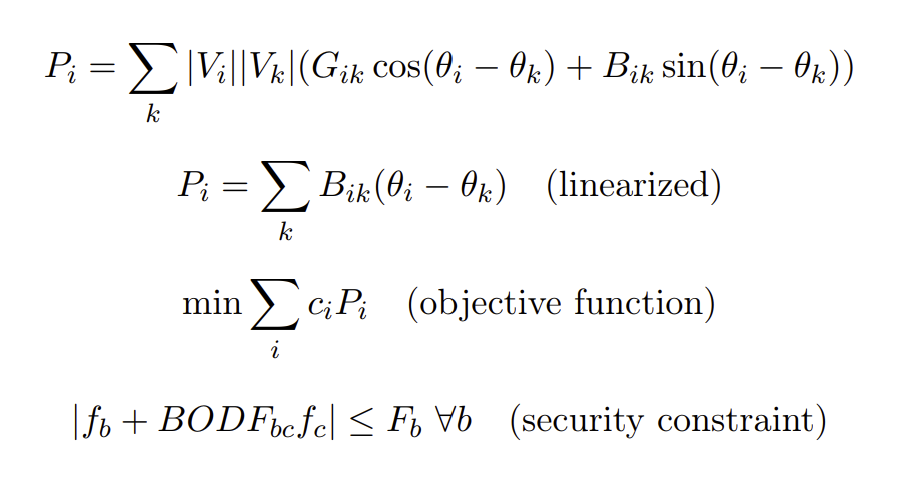 Figure 1: The OPF equations. As Prof. von Meier says, “You may avert your gaze if the sight of the power flow equations does not spark joy.”
To simulate things going wrong, we do something called Security-Constrained Optimal Power Flow (SCOPF), which essentially solves the same optimization problem, but with the constraint that if k lines go out, that the system stays “feasible”, i.e., that it can still meet consumers’ energy demand.
But which k lines should we consider? (Not all lines are equally important or equally likely to fail.) This is the main contribution of my paper– I incorporate a dataset of historical wildfires to identify the lines most susceptible to fire risk, and I use that to identify the weak points in the grid.
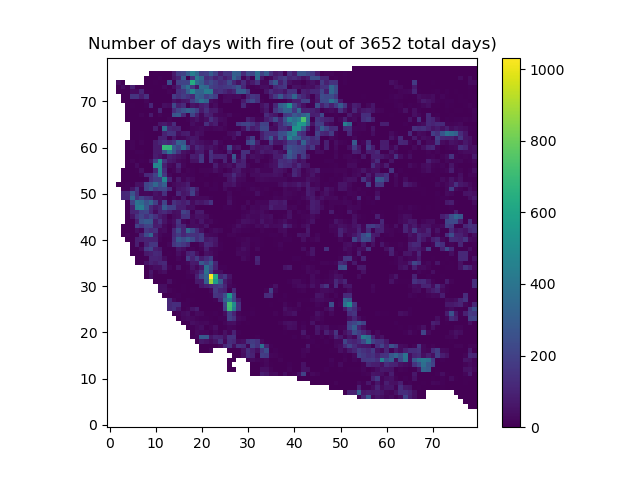
The model was built with a delightful open-source Python tool called PyPSA-USA (Python for Power Systems Analysis). I was very lucky to have randomly bumped into its main developer, Kamran, at a startup pitch night a few months earlier. He helped me learn the lay of the land, pointing out little quirks and debugging tips that saved me hours of struggle. Even so, getting the model up and running was the hardest part of the project for sure. The model was too big for my poor little PC, so I had to tussle with Stanford’s cluster computing environment (the “rice” node was running out of memory so I had to upgrade to a “wheat” node… whatever that means). Even after making several simplifying assumptions and reducing the model size, the optimization job still took 4 hours to run end-to-end.
But once it finished, I could use PyPSA to make some pretty nice graphs, like these:
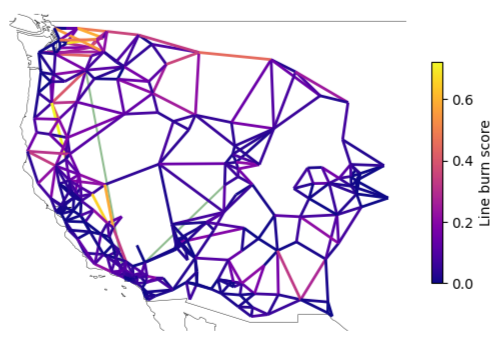
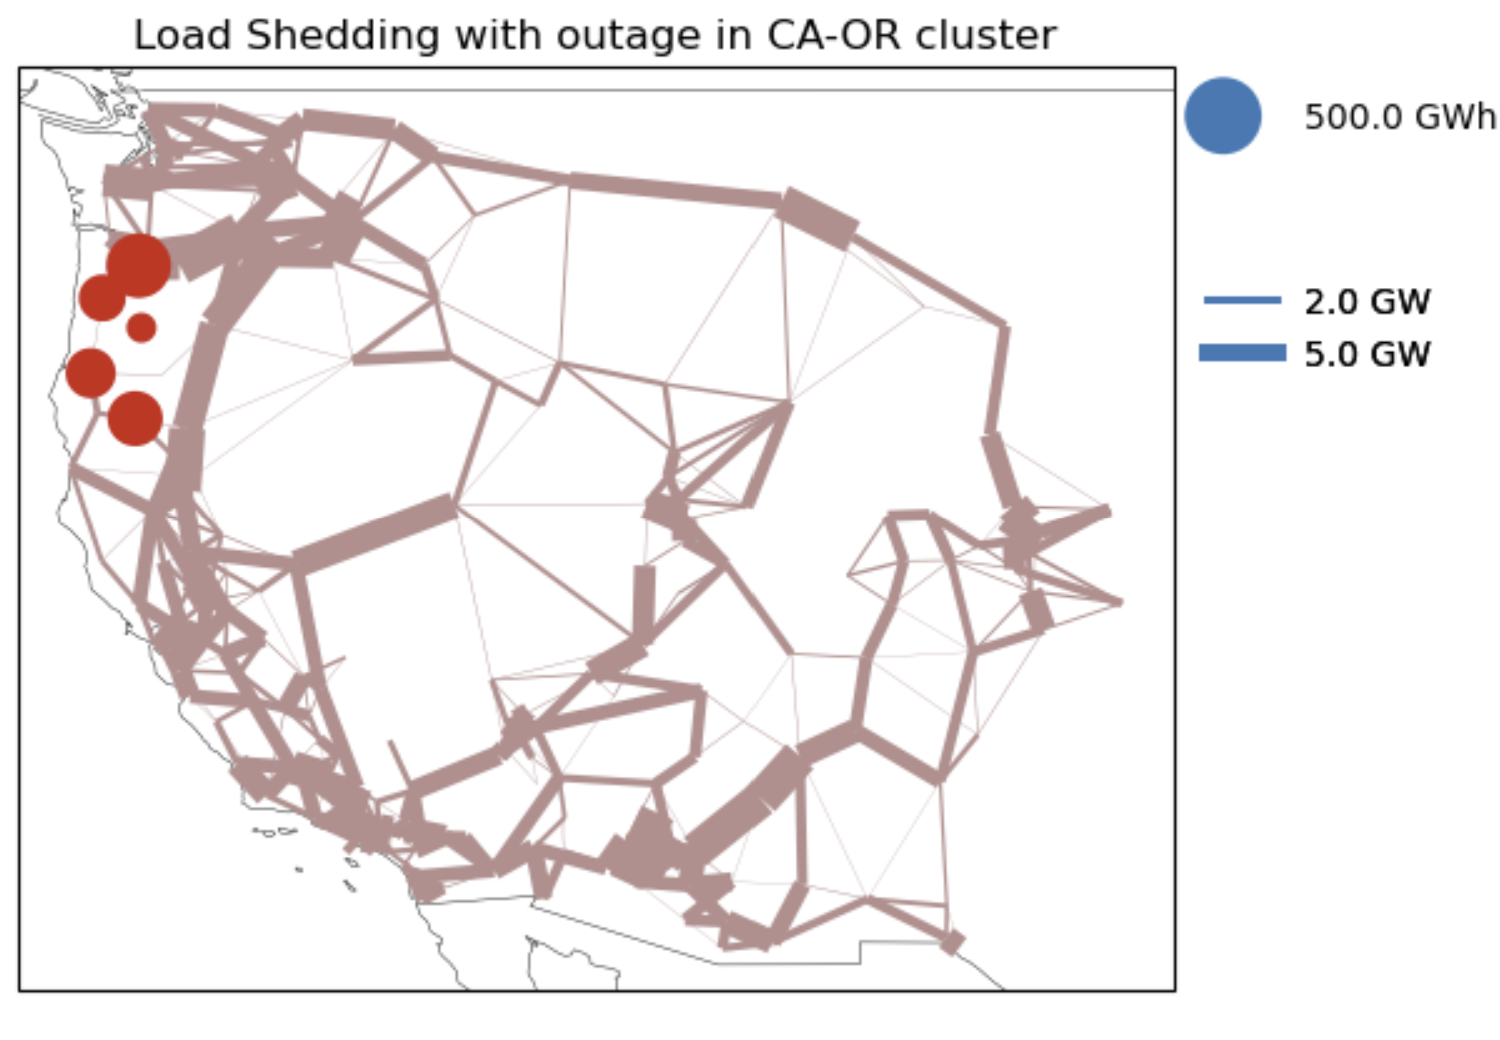
The first graph is a map of transmission lines colored by wildfire risk. The highest-risk area is the northern Pacific coast. Although eastern Montana has a lot of wildfires too, they don’t show up as strongly in this map because there aren’t many transmission lines there.
The second graph simulates the effect of a fire near the California-Oregon border. The simulated fire touches 18 transmission lines and incurs a huge system cost. Some power is diverted through parallel lines to the east, but consumers in Oregon experience massive outages (the red dots in the graph). Thus, I believe that Oregon is a top-priority area to invest in new power generation.
Limitations
At the end of the day, this is just a class project, and it’s important that I recognize my model’s limitations. So I spend a third of my paper discussing the various ways my model is inadequate:
- The power flow equations describe a steady-state equilibrium. They do not model the high-frequency dynamics3 that occur in the seconds after an unplanned disruption. For that, we would need more complex physical equations that model harmonic oscillations in the power waveforms.
- My fire model is also a simple steady-state model. It doesn’t capture the dynamic evolution of fire through space and time.
- I’m not even considering other important climate risks like heat waves, flash floods, and wind storms.
- Most importantly, my grid model isn’t granular enough. There are thousands of transmission lines in the Western US, but because of my computational constraints, I only model 500 lines. (I reduce the number of lines by clustering together nearby grid nodes and pretending that there are only lines between the clusters.) I cannot match the granularity of production-grade models, which run on hyper-specialized optimization software.
The granularity has a significant impact on the model’s accuracy and overall dynamics. In figure 2, I observe a “cliff” when experimenting with a tiny 100-line network. As I take out more and more lines, the system stays relatively stable, until I take out the 76th line, then the power outages skyrocket. This 76th line is like the straw that breaks the camel’s back.
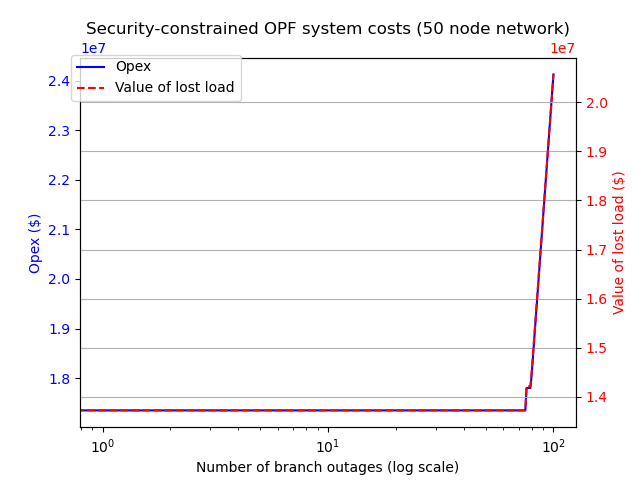 Figure 2: Lost load as a function of number of lines removed. Network size: 50 buses, 100 lines.
When Prof Rajagopal read my paper, he found this the most interesting part. But it’s partially just an artifact of the small model size, as my larger 500-line network doesn’t exhibit as sharp of a cliff.
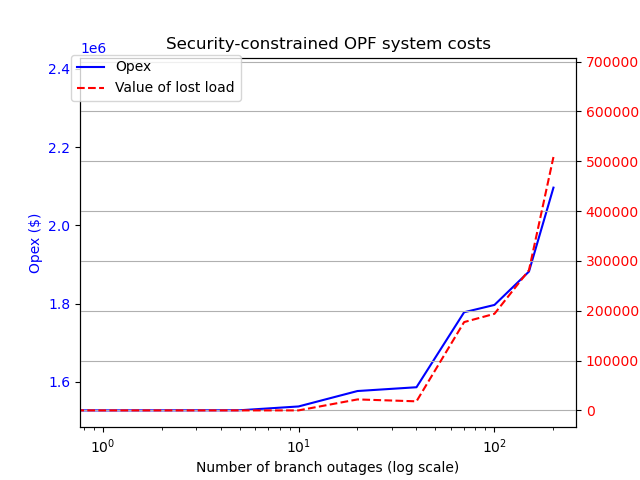 Figure 3: Lost load as a function of number of lines removed. Network size: 100 buses, 500 lines.
It’s like panning for gold. When you play around with a model for long enough, interesting signals and behaviors are often revealed to be merely fool’s gold. (For another example, at one point, PyPSA told me that the optimal thing to do was to double the number of transmission lines in the US. But politically, that’s simply infeasible, so it’s not a useful result.)
As a practitioner, it’s important to approach your problem with epistemic humility and to understand the limitations of your models. Statistician George Box famously said “All models are wrong, but some are useful.” There are so many ways for a model to be wrong. Extracting the usefulness out of it takes a great deal of patience and reflection.
If there’s anything I take away from this project, it is a slightly better understanding of the mysterious art of mathematical modeling. Modeling is as much an art as a science; it’s about developing taste. It can be practiced in the same way that a young pianist practices scales and arpeggios. It’s not about knowing some fancy mathematical concept4 or knowing every page in the textbook. It’s about mastering the fundamentals: Visualize your data. Test your code. Use linear approximations. Perform sensitivity analyses. Interpret your results in context. This will give you a firm foundation upon which you can layer more complex techniques.
ChatGPT
If there’s anything else I take away from this project, it is a slightly better understanding of how to use AI for research. The last time I took classes in 2019, gen AI was most definitely not a thing. This time around, I was pleasantly surprised by ChatGPT’s ability to:
- speed up the initial research phase
- find related literature
- brainstorm research questions
- sanity-check my understanding of core concepts (e.g., “Can power flow model high-frequency harmonic effects or not?”)
- handle boilerplate coding tasks
- generate visualizations
- debug simple issues
Emphasis here on the simple. For complex debugging or conceptual tasks, there’s no way I could have gotten through it all without feedback and mentorship from human experts: Prof Rajagopal, Kamran, and the teaching fellows. Peppering Prof Rajagopal with questions while walking from the classroom to Coupa Café was infinitely more valuable to me than ChatGPT.
Some self-reflection
This project drained me. I was constantly stressed out. I got sick multiple times and started losing my hair. I took a week off from work. And I did an entire two-person project on my own because my partner flaked (a story for another time). This was easily one of the hardest things I did in 2025. And after all that, I ended up with… what? A toy model and a mediocre 5-page paper that, if I had spent twice as much effort, could maybe possibly have been turned into a low-level conference paper?
Looking back on it all, I don’t quite know how to feel. On one hand, I’m proud that I gave it a good solid effort. I proved to myself that I could do a technical side project. On the other hand, I feel paralyzed by the Sisyphean mountain of research and knowledge of which I barely scratched the surface. If writing a 5-page paper took so much effort, how could I even fathom writing a thesis or a textbook? It boggles my mind that most folks my age are already wrapping up their PhDs and landing assistant professorships. Like, it doesn’t make any sense. They must be a different species.
During my moments of paralysis, I credit my friends for giving me the motivation to keep grinding. I was recently getting coffee with a friend and pouring out my existential angst, and he was like, “Just put one foot in front of the other. Try to get 0.01% better every day, and let the law of compounding do the rest.”
I can sort of squint and see myself carving out a niche as a math modeling specialist. It’s a hazy but compelling vision: unlocking value by marrying solid technical fundamentals with a nose for insights like a truffle pig. It’ll surely take 10000 more hours of practice to get there, but I’d like to think that my background in scales and arpeggios gives me some useful transferable skills.
Plans for 2026
I’d like to keep doing projects like this. However, first and more importantly, I need to fix my sleep schedule. 🙃 Therefore, for the next 6 months I will be temporarily scaling back on work/school and prioritizing mental and physical health. I’ll be spending more time exploring New York City and connecting with the community. I want to play pickleball, learn Brazilian jiu jitsu, write more essays, meet new people, and find an awesome music group like my last one in California.
To that end, any leads are appreciated. If you know of a good underwater basket-weaving social club or whatever in the NYC area, please let me know!
Thanks, and happy new year!
Elbert
-
It’s much easier to solve linear equations than nonlinear ones. This is itself a whole course-worth of material. ↩
-
This is itself also a course-worth of material. ↩
-
What does “dynamics” mean? This is itself a course-worth of material. I actually really liked taking that course! But since it was almost a decade ago, I don’t remember anything besides the fact that I liked it. I’d be hard-pressed to tell you what a Hopf bifurcation is. ↩
-
The relevant fancy mathematical concept here is the conjugate gradient method for solving sparse linear systems. The grid network can be expressed as a sparse incidence matrix, so the power flow equations can be expressed as a sparse linear system. We must solve these equations for the power and the voltage at each node of the network. To do this efficiently, there are a number of fancy techniques we can employ, such as conjugate gradient. (When I asked Prof Darve for an example of how to apply linear algebra to climate tech, this was his go-to example.) ↩